March 14, 2019
OpenBSD Amsterdam was in search of a lightweight toolset to keep track of resource usage, at a minimum the CPU load generated by the vmm(4)/vmd(8) hosts and the traffic from and to the hosts. A couple of weeks ago we ended up with a workable MRTG Setup. While it worked, it didn’t look very pretty.
In a moment of clarity, we thought about using RRDtool. Heck, why shouldn’t we give it a try? From the previous tooling, we already had some required building blocks in place to make MRTG understand the CPU Cores and uptime from OpenBSD.
Before we start:
# pkg_add rrdtool
#
We decided to split the collection of the different OIDs (SNMP Object Identifiers) into three different scripts, which cron(1) calls, from a wrapper script.
#!/bin/sh
test -n "$1" || exit 1
HOST="$1"
COMMUNITY="public"
UPTIMEINFO="/tmp/${HOST}-uptime.txt"
TICKS=$(snmpctl snmp get ${HOST} community ${COMMUNITY} oid hrSystemUptime.0 | cut -d= -f2)
DAYS=$(echo "${TICKS}/8640000" | bc -l)
HOURS=$(echo "0.${DAYS##*.} * 24" | bc -l)
MINUTES=$(echo "0.${HOURS##*.} * 60" | bc -l)
SECS=$(echo "0.${MINUTES##*.} * 60" | bc -l)
test -n "$DAYS" && printf '%s days, ' "${DAYS%.*}" > ${UPTIMEINFO}
printf '%02d\\:%02d\\:%02d\n' "${HOURS%.*}" "${MINUTES%.*}" "${SECS%.*}" >> ${UPTIMEINFO}
This is a seperate script, due to the uptime usage of both hosts in both graphs.
The origins for this script can be found detailled in our MRTG Setup.
test -n "$1" || exit 1
HOST="$1"
COMMUNITY="public"
RRDFILES="/var/rrdtool"
IMAGES="/var/www/htdocs"
WATERMARK="OpenBSD Amsterdam - https://obsda.ms"
RRDTOOL="/usr/local/bin/rrdtool"
CPUINFO="/tmp/${HOST}-cpu.txt"
UPTIME=$(cat /tmp/${HOST}-uptime.txt)
NOW=$(date "+%Y-%m-%d %H:%M:%S %Z" | sed 's/:/\\:/g')
if ! test -f "${RRDFILES}/${HOST}-cpu.rrd"
then
echo "Creating ${RRDFILES}/${HOST}-cpu.rrd"
${RRDTOOL} create ${RRDFILES}/${HOST}-cpu.rrd \
--step 300 \
DS:ds0:GAUGE:600:U:U \
RRA:MAX:0.5:1:20000
fi
snmpctl snmp walk ${HOST} community ${COMMUNITY} oid hrProcessorLoad | cut -d= -f2 > ${CPUINFO}
CORES=$(grep -cv "^0$" ${CPUINFO})
CPU_LOAD_SUM=$(awk '{sum += $1} END {print sum}' ${CPUINFO})
CPU_LOAD=$(echo "scale=2; ${CPU_LOAD_SUM}/${CORES}" | bc -l)
${RRDTOOL} update ${RRDFILES}/${HOST}-cpu.rrd N:${CPU_LOAD}
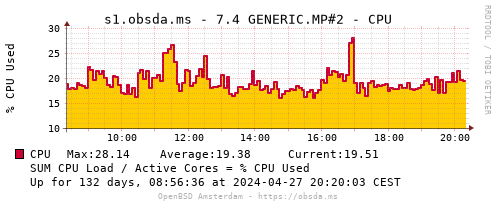
${RRDTOOL} graph ${IMAGES}/${HOST}-cpu.png \
--start -43200 \
--title "${HOST} - CPU" \
--vertical-label "% CPU Used" \
--watermark "${WATERMARK}" \
DEF:CPU=${RRDFILES}/${HOST}-cpu.rrd:ds0:AVERAGE \
AREA:CPU#FFCC00 \
LINE2:CPU#CC0033:"CPU" \
GPRINT:CPU:MAX:"Max\:%2.2lf %s" \
GPRINT:CPU:AVERAGE:"Average\:%2.2lf %s" \
GPRINT:CPU:LAST:" Current\:%2.2lf %s\n" \
COMMENT:"\\n" \
COMMENT:" SUM CPU Load / Active Cores = % CPU Used\n" \
COMMENT:" Up for ${UPTIME} at ${NOW}"
On the first run, RRDtool will create the .rrd file. On every subsequent run, it will update the file with the collected values and update the graph.
The origins for this script can be found detailled in our MRTG Setup.
test -n "$1" || exit 1
test -n "$2" || exit 1
HOST="$1"
INTERFACE="$2"
COMMUNITY="public"
RRDFILES="/var/rrdtool"
IMAGES="/var/www/htdocs"
WATERMARK="OpenBSD Amsterdam - https://obsda.ms"
RRDTOOL="/usr/local/bin/rrdtool"
UPTIME=$(cat /tmp/${HOST}-uptime.txt)
NOW=$(date "+%Y-%m-%d %H:%M:%S %Z" | sed 's/:/\\:/g')
if ! test -f "${RRDFILES}/${HOST}-${INTERFACE}.rrd"
then
echo "Creating ${RRDFILES}/${HOST}-${INTERFACE}.rrd"
${RRDTOOL} create ${RRDFILES}/${HOST}-${INTERFACE}.rrd \
--step 300 \
DS:ds0:COUNTER:600:0:1250000000 \
DS:ds1:COUNTER:600:0:1250000000 \
RRA:AVERAGE:0.5:1:600 \
RRA:AVERAGE:0.5:6:700 \
RRA:AVERAGE:0.5:24:775 \
RRA:AVERAGE:0.5:288:797 \
RRA:MAX:0.5:1:600 \
RRA:MAX:0.5:6:700 \
RRA:MAX:0.5:24:775 \
RRA:MAX:0.5:288:797
fi
IN=$(snmpctl snmp get ${HOST} community ${COMMUNITY} oid ifInOctets.${INTERFACE} | cut -d= -f2)
OUT=$(snmpctl snmp get ${HOST} community ${COMMUNITY} oid ifOutOctets.${INTERFACE} | cut -d= -f2)
DESCR=$(snmpctl snmp get ${HOST} community ${COMMUNITY} oid ifDescr.${INTERFACE} | cut -d= -f2 | tr
-d '"')
${RRDTOOL} update ${RRDFILES}/${HOST}-${INTERFACE}.rrd N:${IN}:${OUT}
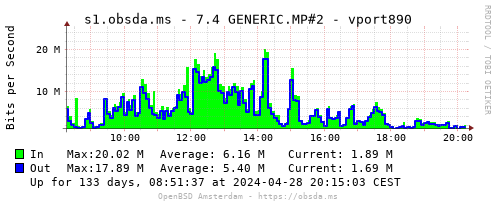
${RRDTOOL} graph ${IMAGES}/${HOST}-${INTERFACE}.png \
--start -43200 \
--title "${HOST} - ${DESCR}" \
--vertical-label "Bits per Second" \
--watermark "${WATERMARK}" \
DEF:IN=${RRDFILES}/${HOST}-${INTERFACE}.rrd:ds0:AVERAGE \
DEF:OUT=${RRDFILES}/${HOST}-${INTERFACE}.rrd:ds1:AVERAGE \
CDEF:IN_CDEF="IN,8,*" \
CDEF:OUT_CDEF="OUT,8,*" \
AREA:IN_CDEF#00FF00:"In " \
GPRINT:IN_CDEF:MAX:"Max\:%5.2lf %s" \
GPRINT:IN_CDEF:AVERAGE:"Average\:%5.2lf %s" \
GPRINT:IN_CDEF:LAST:" Current\:%5.2lf %s\n" \
LINE2:OUT_CDEF#0000FF:"Out" \
GPRINT:OUT_CDEF:MAX:"Max\:%5.2lf %s" \
GPRINT:OUT_CDEF:AVERAGE:"Average\:%5.2lf %s" \
GPRINT:OUT_CDEF:LAST:" Current\:%5.2lf %s\n" \
COMMENT:"\\n" \
COMMENT:" Up for ${UPTIME} at ${NOW}"
To pinpoint the network interface you want to measure the bandwith for, this command prints the available interfaces:
snmpctl snmp walk [host] community [community] oid ifDescr
This will output a list like:
ifDescr.1 = STRING: em0
ifDescr.2 = STRING: em1
ifDescr.3 = STRING: em2
ifDescr.4 = STRING: em3
ifDescr.5 = STRING: enc0
ifDescr.6 = STRING: lo0
ifDescr.7 = STRING: veb890
ifDescr.8 = STRING: vlan910
ifDescr.9 = STRING: vport890
ifDescr.10 = STRING: pflog0
ifDescr.11 = STRING: tap0
ifDescr.12 = STRING: tap1
The number behind ifDescr is the one that you need to feed to interface.sh, for example:
# interface.sh 9
Finally the wrapper.sh script calls all the aforementioned scripts:
#!/bin/sh
SCRIPTS="/var/rrdtool"
for i in $(jot 2 1); do ${SCRIPTS}/uptime.sh host${i}.domain.tld; done
for i in $(jot 2 1); do ${SCRIPTS}/cpu_load.sh host${i}.domain.tld; done
${SCRIPTS}/interface.sh host1.domain.tld 12
${SCRIPTS}/interface.sh host2.domain.tld 11
The resulting graphs:
To serve the graphs we use httpd(8) with the following config:
server “default” {
        listen on * port 80
        location “/.well-known/acme-challenge/*” {
                root “/acme”
                request strip 2
        }
        location * {
                block return 302 “https://$HTTPHOST$REQUESTURI”
        }
}
server “default” {
        listen on * tls port 443
        tls {
                certificate “/etc/ssl/default-fullchain.pem”
                key “/etc/ssl/private/default.key”
        }
        location “/.well-known/acme-challenge/*” {
                root “/acme”
                request strip 2
        }
        root “/htdocs”
}
All the scripts can be found in our Git Repository.